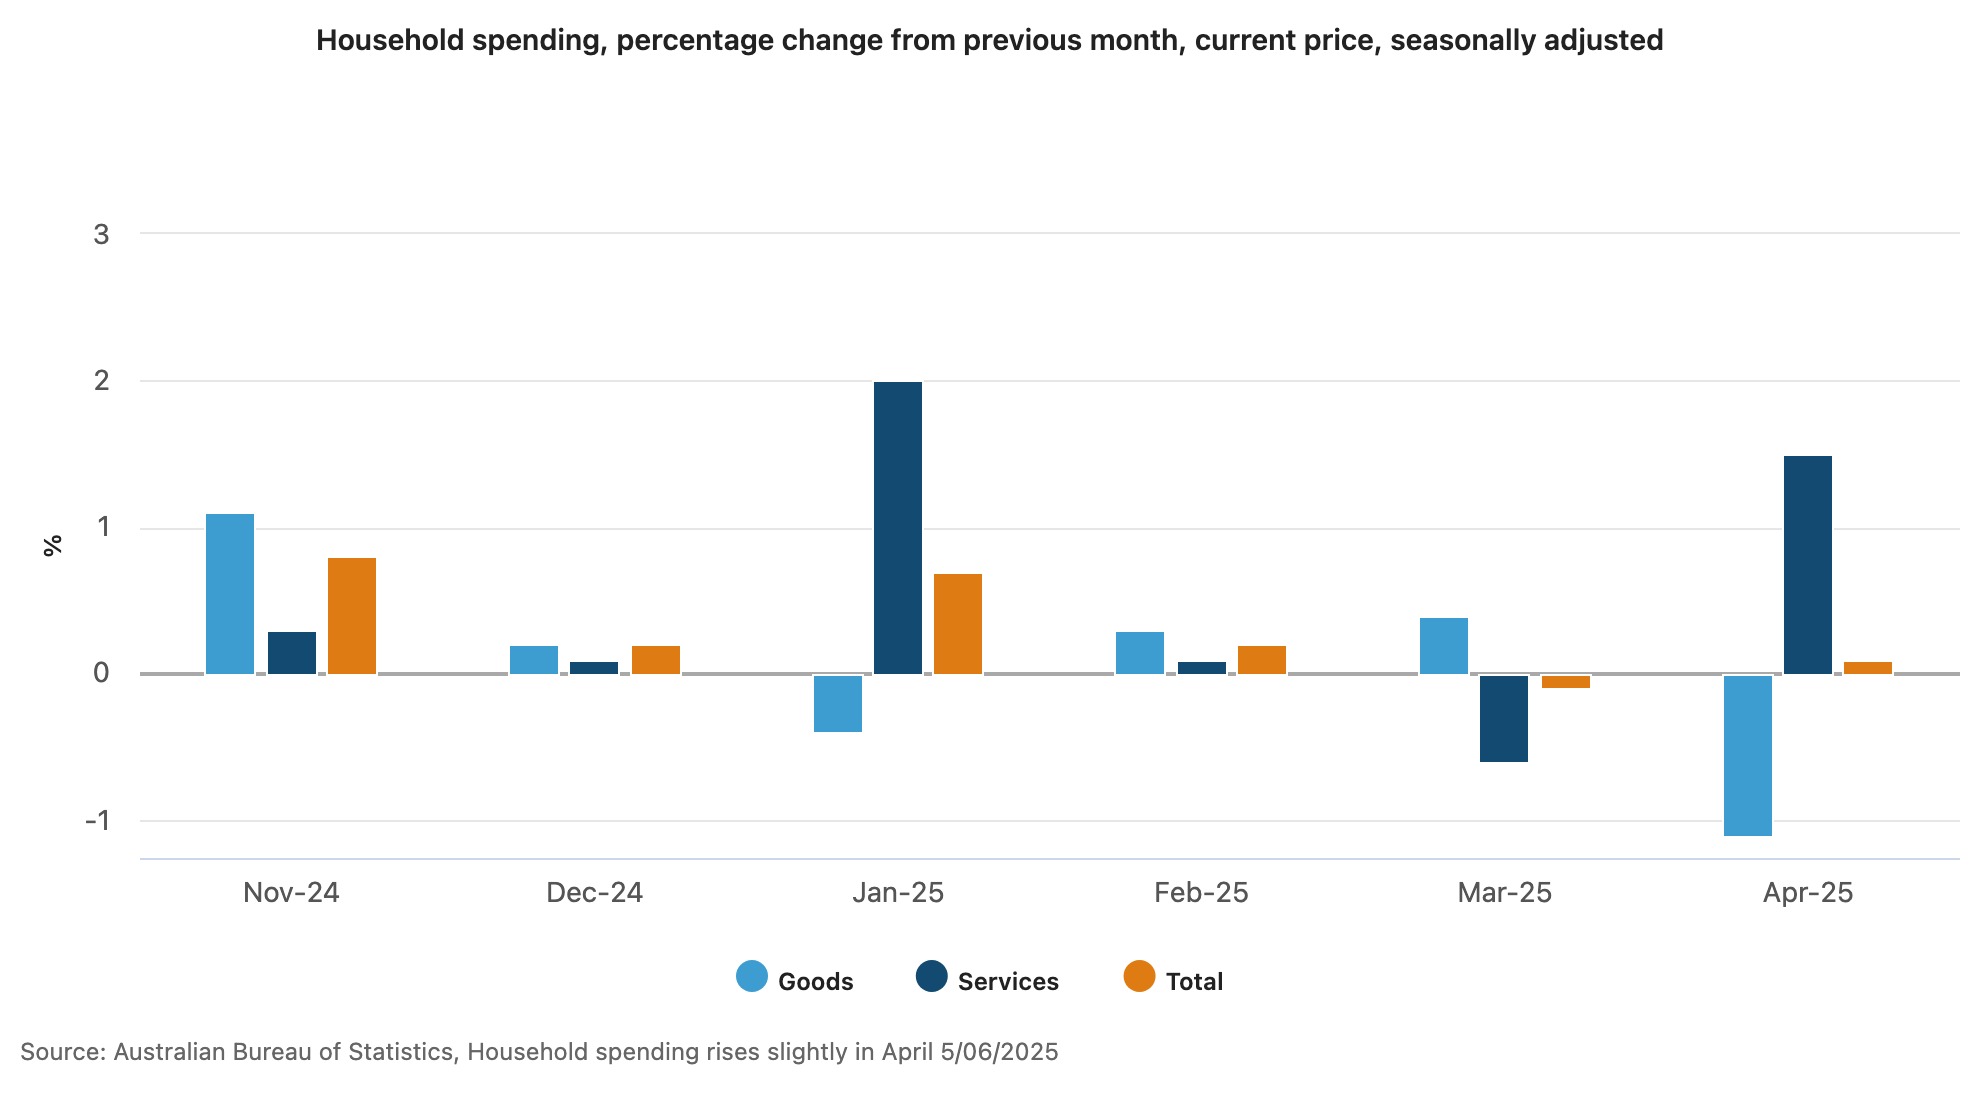
Household spending in Australia rose by 0.1% in April, according to seasonally adjusted figures released by the Australian Bureau of Statistics on Thursday. This follows a 0.1% fall in March and a 0.2% increase in February.
“Household spending remained steady in April, with a rise in spending on services being partly offset by a fall in goods spending,” said Robert Ewing, head of business statistics at the ABS.
“Spending on recreational and cultural activities, health, and dining out contributed to a 1.5% rise in services spending,” he said. “Spending on goods fell by 1.1%, with households buying less clothing and footwear and new vehicles.”
Out of the nine spending categories tracked, three recorded increases. Hotels, cafes, and restaurants rose by 2.2%, while health spending increased by 1.6%. Clothing and footwear recorded the largest monthly drop, falling by 3.5%.
Compared to the same time last year, total household spending was 3.7% higher. Services spending increased by 7.2%, while goods spending rose by 0.9%. The largest annual rises were recorded in hotels, cafes, and restaurants, up 7.7%, and health, up 6.9%.
Spending rose in two out of eight states and territories. Queensland posted the strongest growth at 2.0%, recovering from a 1.3% fall in March attributed to ex-Tropical Cyclone Alfred. Western Australia recorded a smaller increase of 0.5%.
Tasmania saw the largest monthly decline at 1.5%, followed by the Northern Territory with a 0.9% drop, and Victoria at 0.8%.
Ewing noted that recent changes to data reporting will lead to a shift in how household spending is measured.
“The improvements made to the MHSI mean the Retail Trade publication will end from 31 July 2025,” he said. “The improved MHSI data will give a more comprehensive view of household spending and save businesses time by removing the need to complete a Retail Business Survey.”
The ABS’s Monthly Household Spending Indicator is compiled from aggregated and de-identified bank transactions, scanner data from supermarkets, and vehicle sales records. It covers nine categories aligned with international consumption classifications.
What are your thoughts on the recent findings? Share your insights below.